apmap silencer select sirna Search Results


90
Thermo Fisher apmap sirna
A. (Top) qPCR of <t>APMAP</t> mRNA levels and (Bottom) western blot of APMAP protein levels validating efficient <t>siRNA-mediated</t> APMAP (siAPMAP) knockdown (N=3; **P<0.0021; *P<0.0322; Two tailed unpaired t-test) B. Airyscan confocal micrographs of Huh7 cells treated with scrambled (siCtrl) and siAPMAP. Cells were IF stained using α-Calnexin (green) or α-CLIMP63 (magenta). Scale Bar = 5 μm C. Confocal micrographs of siCtrl and siAPMAP treated Huh7 cells, co-IF stained with α-Calnexin (green) and α-CLIMP63 (magenta). Scale bar = 10 μm. Line scans (straight line with 5 pixel width) representing spatial distribution of calnexin (green) and CLIMP63 (magenta) were produced using “plot profile’ function in ImageJ D. Violin scatter dot plots demonstrating ER membrane expansion in siCtrl and siAPMAP treated Huh7 cells. The plot depicts the ratio of the percent area of CLIMP-63 positive pixels of CLIMP63 over percent positive pixels of Calnexin per cell. Individual data points from more than 50 cells from three sets of independent experiments (**** P<0.0001; Ordinary one-way ANOVA) E. qPCR quantification of mRNA levels of ER stress marker genes (CHOP, ATF6 and spXBP1) from siCtrl and siAPMAP treated cells. N=3, **P<0.0021; Multiple unpaired t-tests Holm-Šídák method with alpha = 0.05 F. Confocal micrographs showing LDs in siCtrl and siAPMAP treated Huh7 cells. LDs were visualized by MDH (gray). Scale bar= 10 μm G. Violin plot representing quantified average area covered by LDs per cell. Total LD area was derived from more than 10 fields of view, each consisting of 10-15 cells and from three sets of experiments (****P<0.0001; one-way ANOVA with Sidak’s multiple comparisons; α = 0.05) H. TEM micrographs of siCtrl and siAPMAP treated U2OS cells followed by a 16h OA treatment to visualize LD morphology. Scale bar= 1 μm I. Quantification of TAG levels in siCtrl and siAPMAP treated cells, using TLC (in micrograms). Data represent mean ± SEM normalized to cell pellet weight; N = 3; ***P<0.0002; Two tailed unpaired t-test
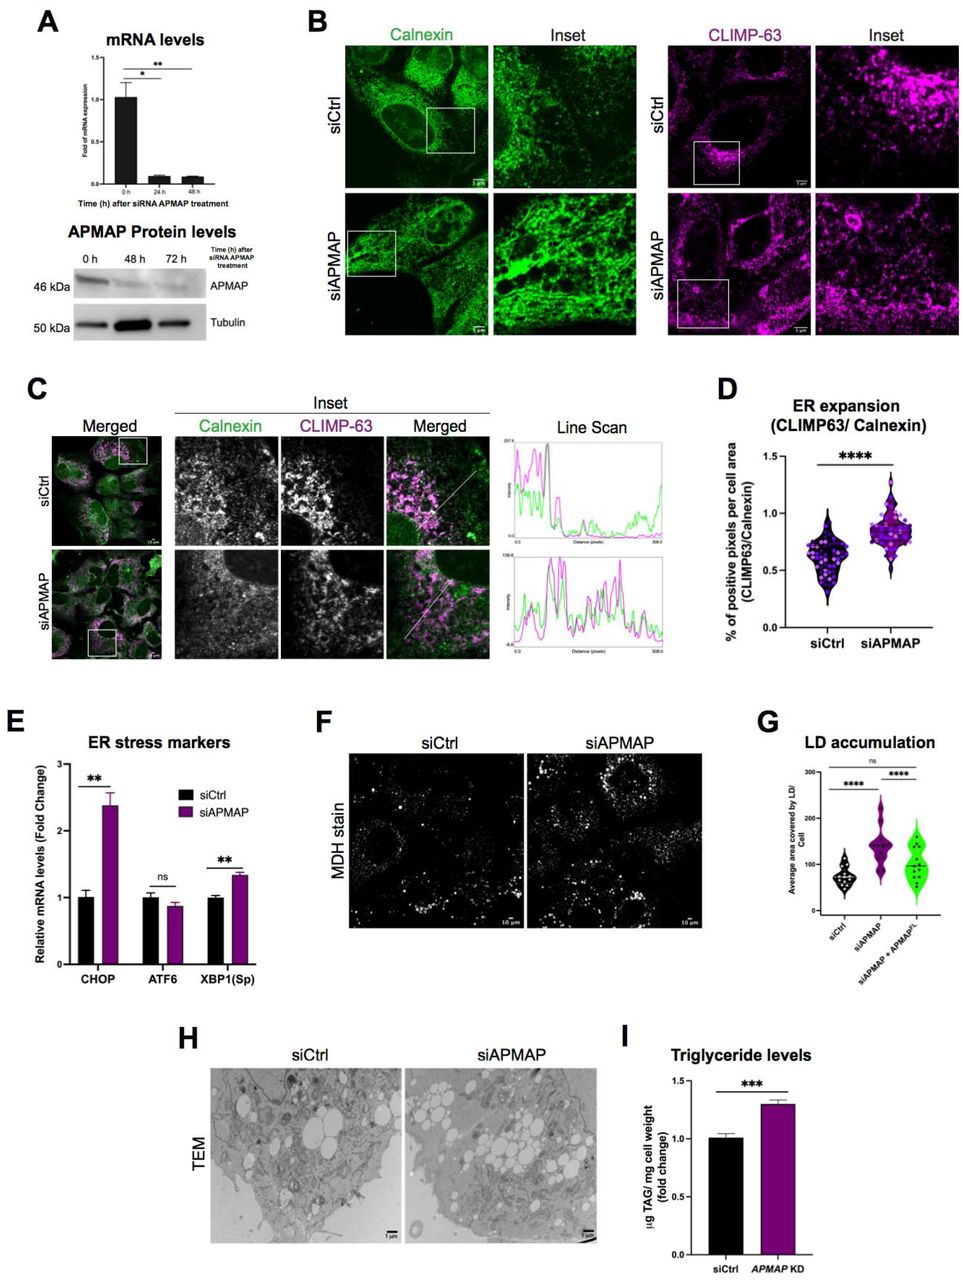
Apmap Sirna, supplied by Thermo Fisher, used in various techniques. Bioz Stars score: 90/100, based on 1 PubMed citations. ZERO BIAS - scores, article reviews, protocol conditions and more
https://www.bioz.com/result/apmap sirna/product/Thermo Fisher
Average 90 stars, based on 1 article reviews
apmap sirna - by Bioz Stars, 2026-02
90/100 stars
  Buy from Supplier

90
Thermo Fisher apmap silencer select sirna
A. (Top) qPCR of <t>APMAP</t> mRNA levels and (Bottom) western blot of APMAP protein levels validating efficient <t>siRNA-mediated</t> APMAP (siAPMAP) knockdown (N=3; **P<0.0021; *P<0.0322; Two tailed unpaired t-test) B. Airyscan confocal micrographs of Huh7 cells treated with scrambled (siCtrl) and siAPMAP. Cells were IF stained using α-Calnexin (green) or α-CLIMP63 (magenta). Scale Bar = 5 μm C. Confocal micrographs of siCtrl and siAPMAP treated Huh7 cells, co-IF stained with α-Calnexin (green) and α-CLIMP63 (magenta). Scale bar = 10 μm. Line scans (straight line with 5 pixel width) representing spatial distribution of calnexin (green) and CLIMP63 (magenta) were produced using “plot profile’ function in ImageJ D. Violin scatter dot plots demonstrating ER membrane expansion in siCtrl and siAPMAP treated Huh7 cells. The plot depicts the ratio of the percent area of CLIMP-63 positive pixels of CLIMP63 over percent positive pixels of Calnexin per cell. Individual data points from more than 50 cells from three sets of independent experiments (**** P<0.0001; Ordinary one-way ANOVA) E. qPCR quantification of mRNA levels of ER stress marker genes (CHOP, ATF6 and spXBP1) from siCtrl and siAPMAP treated cells. N=3, **P<0.0021; Multiple unpaired t-tests Holm-Šídák method with alpha = 0.05 F. Confocal micrographs showing LDs in siCtrl and siAPMAP treated Huh7 cells. LDs were visualized by MDH (gray). Scale bar= 10 μm G. Violin plot representing quantified average area covered by LDs per cell. Total LD area was derived from more than 10 fields of view, each consisting of 10-15 cells and from three sets of experiments (****P<0.0001; one-way ANOVA with Sidak’s multiple comparisons; α = 0.05) H. TEM micrographs of siCtrl and siAPMAP treated U2OS cells followed by a 16h OA treatment to visualize LD morphology. Scale bar= 1 μm I. Quantification of TAG levels in siCtrl and siAPMAP treated cells, using TLC (in micrograms). Data represent mean ± SEM normalized to cell pellet weight; N = 3; ***P<0.0002; Two tailed unpaired t-test
Apmap Silencer Select Sirna, supplied by Thermo Fisher, used in various techniques. Bioz Stars score: 90/100, based on 1 PubMed citations. ZERO BIAS - scores, article reviews, protocol conditions and more
https://www.bioz.com/result/apmap silencer select sirna/product/Thermo Fisher
Average 90 stars, based on 1 article reviews
apmap silencer select sirna - by Bioz Stars, 2026-02
90/100 stars
  Buy from Supplier

N/A
Gene Silencers generally consist of pools of three to five target specific 19 25 nucleotide sequences in length For independent verification of APMAP gene silencing results individual duplex components or plasmids are also available upon
  Buy from Supplier

N/A
Gene Silencers generally consist of pools of three to five target specific 19 25 nucleotide sequences in length For independent verification of WBSCR16 gene silencing results individual duplex components or plasmids are also available upon
  Buy from Supplier

N/A
Gene Silencers generally consist of pools of three to five target specific 19 25 nucleotide sequences in length For independent verification of WBSCR18 gene silencing results individual duplex components or plasmids are also available upon
  Buy from Supplier

N/A
Gene Silencers generally consist of pools of three to five target specific 19 25 nucleotide sequences in length For independent verification of WBSCR27 gene silencing results individual duplex components or plasmids are also available upon
  Buy from Supplier

N/A
Gene Silencers generally consist of pools of three to five target specific 19 25 nucleotide sequences in length For independent verification of Obscurin gene silencing results individual duplex components or plasmids are also available upon
  Buy from Supplier

N/A
Gene Silencers generally consist of pools of three to five target specific 19 25 nucleotide sequences in length For independent verification of APMAP gene silencing results individual duplex components or plasmids are also available upon
  Buy from Supplier

N/A
Gene Silencers generally consist of pools of three to five target specific 19 25 nucleotide sequences in length For independent verification of WBSCR17 gene silencing results individual duplex components or plasmids are also available upon
  Buy from Supplier

N/A
Gene Silencers generally consist of pools of three to five target specific 19 25 nucleotide sequences in length For independent verification of WBSCR28 gene silencing results individual duplex components or plasmids are also available upon
  Buy from Supplier

N/A
Gene Silencers generally consist of pools of three to five target specific 19 25 nucleotide sequences in length For independent verification of WBSCR28 gene silencing results individual duplex components or plasmids are also available upon
  Buy from Supplier

N/A
Gene Silencers generally consist of pools of three to five target specific 19 25 nucleotide sequences in length For independent verification of WBSCR28 gene silencing results individual duplex components or plasmids are also available upon
  Buy from Supplier

Image Search Results


A. (Top) qPCR of APMAP mRNA levels and (Bottom) western blot of APMAP protein levels validating efficient siRNA-mediated APMAP (siAPMAP) knockdown (N=3; **P<0.0021; *P<0.0322; Two tailed unpaired t-test) B. Airyscan confocal micrographs of Huh7 cells treated with scrambled (siCtrl) and siAPMAP. Cells were IF stained using α-Calnexin (green) or α-CLIMP63 (magenta). Scale Bar = 5 μm C. Confocal micrographs of siCtrl and siAPMAP treated Huh7 cells, co-IF stained with α-Calnexin (green) and α-CLIMP63 (magenta). Scale bar = 10 μm. Line scans (straight line with 5 pixel width) representing spatial distribution of calnexin (green) and CLIMP63 (magenta) were produced using “plot profile’ function in ImageJ D. Violin scatter dot plots demonstrating ER membrane expansion in siCtrl and siAPMAP treated Huh7 cells. The plot depicts the ratio of the percent area of CLIMP-63 positive pixels of CLIMP63 over percent positive pixels of Calnexin per cell. Individual data points from more than 50 cells from three sets of independent experiments (**** P<0.0001; Ordinary one-way ANOVA) E. qPCR quantification of mRNA levels of ER stress marker genes (CHOP, ATF6 and spXBP1) from siCtrl and siAPMAP treated cells. N=3, **P<0.0021; Multiple unpaired t-tests Holm-Šídák method with alpha = 0.05 F. Confocal micrographs showing LDs in siCtrl and siAPMAP treated Huh7 cells. LDs were visualized by MDH (gray). Scale bar= 10 μm G. Violin plot representing quantified average area covered by LDs per cell. Total LD area was derived from more than 10 fields of view, each consisting of 10-15 cells and from three sets of experiments (****P<0.0001; one-way ANOVA with Sidak’s multiple comparisons; α = 0.05) H. TEM micrographs of siCtrl and siAPMAP treated U2OS cells followed by a 16h OA treatment to visualize LD morphology. Scale bar= 1 μm I. Quantification of TAG levels in siCtrl and siAPMAP treated cells, using TLC (in micrograms). Data represent mean ± SEM normalized to cell pellet weight; N = 3; ***P<0.0002; Two tailed unpaired t-test

Journal: bioRxiv

Article Title: Paraoxonase-like APMAP maintains endoplasmic reticulum-associated lipid and lipoprotein homeostasis

doi: 10.1101/2024.01.26.577049

Figure Lengend Snippet: A. (Top) qPCR of APMAP mRNA levels and (Bottom) western blot of APMAP protein levels validating efficient siRNA-mediated APMAP (siAPMAP) knockdown (N=3; **P<0.0021; *P<0.0322; Two tailed unpaired t-test) B. Airyscan confocal micrographs of Huh7 cells treated with scrambled (siCtrl) and siAPMAP. Cells were IF stained using α-Calnexin (green) or α-CLIMP63 (magenta). Scale Bar = 5 μm C. Confocal micrographs of siCtrl and siAPMAP treated Huh7 cells, co-IF stained with α-Calnexin (green) and α-CLIMP63 (magenta). Scale bar = 10 μm. Line scans (straight line with 5 pixel width) representing spatial distribution of calnexin (green) and CLIMP63 (magenta) were produced using “plot profile’ function in ImageJ D. Violin scatter dot plots demonstrating ER membrane expansion in siCtrl and siAPMAP treated Huh7 cells. The plot depicts the ratio of the percent area of CLIMP-63 positive pixels of CLIMP63 over percent positive pixels of Calnexin per cell. Individual data points from more than 50 cells from three sets of independent experiments (**** P<0.0001; Ordinary one-way ANOVA) E. qPCR quantification of mRNA levels of ER stress marker genes (CHOP, ATF6 and spXBP1) from siCtrl and siAPMAP treated cells. N=3, **P<0.0021; Multiple unpaired t-tests Holm-Šídák method with alpha = 0.05 F. Confocal micrographs showing LDs in siCtrl and siAPMAP treated Huh7 cells. LDs were visualized by MDH (gray). Scale bar= 10 μm G. Violin plot representing quantified average area covered by LDs per cell. Total LD area was derived from more than 10 fields of view, each consisting of 10-15 cells and from three sets of experiments (****P<0.0001; one-way ANOVA with Sidak’s multiple comparisons; α = 0.05) H. TEM micrographs of siCtrl and siAPMAP treated U2OS cells followed by a 16h OA treatment to visualize LD morphology. Scale bar= 1 μm I. Quantification of TAG levels in siCtrl and siAPMAP treated cells, using TLC (in micrograms). Data represent mean ± SEM normalized to cell pellet weight; N = 3; ***P<0.0002; Two tailed unpaired t-test

Article Snippet: Cells were transfected with scrambled siRNA (Silencer Select negative control, Thermo Fisher 4390843 or Silencer Negative Control 1, Thermo Fisher AM4611) and APMAP siRNA (Silencer Select siRNA, Thermo Fisher s32757) with a final concentration of 10 nM, using Lipofectamine RNAiMAX reagent (Thermo Fisher 13778075) for 48 h. Cells were transfected with pre-incubated siRNA with a final concentration of 10 nM siRNA (3.75 μl of lipofectamine RNAiMAX in 125 μls of Opti-MEM, Gibco 31985-070) for 48 h. Cells were transfected again the following day with 10 nM siRNA for a 72 h total knockdown time.

Techniques: Western Blot, Two Tailed Test, Staining, Produced, Membrane, Marker, Derivative Assay

A. Confocal micrographs of U2OS cells treated with siCtrl, siAPMAP and siAPMAP rescued with siRNA resistant APMAP FL overexpression, incubated with and without TBHP. Cells were stained with BODIPY-C11 to determine the level of oxidation under each condition; Red, reduced form of BODIPY-C11 and Green, oxidized form of BODIPY-C11 B. Line scan (line width of 100 pixels) quantification of 510 nm shift (green; oxidized BODIPY-C11) on the cell surface of siAPMAP treated U2OS cells compared to siCtrl cells C. Fluorescent integrated density of 510 nm shift (green; oxidized) in BODIPY-C11 at the cell periphery was quantified using ImageJ. The statistical significance was assessed by one-way ANOVA with Sidak’s multiple comparison (p=0.0149; 30 cells per condition; N=3). Means +/- SDs shown D. Confocal micrographs of larval FB tissue sections from control ( Dcg-Gal4 line) and dAPMAP-RNAi line with FB-specific RNAi depletion, stained with BODIPY-C11. Images represent oxidized (green) BODIPY-C11 staining and reduced (red) BODIPY-C11 staining in RNAi depleted tissue compared to control tissues. Scale bar= 10 μm E. Quantification of oxidized over reduced BODIPY-C11 in of larval FB tissues represented in was quantified using ImageJ. ***P<0.0021; Two-way ANOVA with Sidak’s multiple comparison F. Live confocal micrographs of siCtrl and siAPMAP treated Huh7 cells expressed with ROS biosensor HyPer-ER lumen (denoted HyPER here) construct showing 405 and 488 stimulated fluorescence for 6 mins after treatment with 2mM H 2 O 2 G. Line graph of fluorescence emission of 488/405 ratio shift measured using HyPer-ERlum in siCtrl and siAPMAP treated Huh7 cells incubated with 2 mM H 2 O 2 . Rescue experiments using different APMAP fragments also shown. Line graphs represent mean of +/- 95% confidence interval (CI) of fluorescence shift. CIs of all conditions shown in dotted lines H. Quantification of oxidized over reduced BODIPY-C11 from WT and APMAP FL overexpressed U2OS cells at 0 and 2 h after 2 mM H 2 O 2 treatment, were quantified using ImageJ. The statistical significance was assessed by Ordinary one-way ANOVA with Sidak’s multiple comparison (****P<0.0001; n = 30; N=3). Means +/- SEMs shown I. Violin scatter dot plots demonstrating rescue experiment of ER membrane expansion in siAPMAP Huh7 cells by treating with 200uM NAC for 16 h. The plot depicts the ratio of the percent area of CLIMP-63 positive pixels over percent positive pixels of Calnexin per cell. Individual data points from more than 50 cells from three sets of independent experiments (**** P<0.0001; ***P<0.0002; Ordinary one-way ANOVA with Sidak’s multiple comparisons; α = 0.05) J. Rescue experiment of LD morphology in siAPMAP Huh7 cells treated using ROS inhibitor NAC for 16 h. Violin scatter dot plots represent average area covered by LDs per cell in a given ROI. Total LD area was derived from more than 10 ROI, each consisting of 10-15 cells from three sets of experiments (N =3, ****p<0.0001; ***P<0.0002; one-way ANOVA with Sidak’s multiple comparison) K. Violin scatter dot plots demonstrating rescuing of intracellular ApoB levels in siAPMAP Huh7 cells through NAC treatment for 16 h. Each dot depicts the percent area of ApoB positive pixels per cell. (n>50; N=3; **** P<0.0001; Ordinary one-way ANOVA with Sidak’s multiple comparisons; α = 0.05)

Journal: bioRxiv

Article Title: Paraoxonase-like APMAP maintains endoplasmic reticulum-associated lipid and lipoprotein homeostasis

doi: 10.1101/2024.01.26.577049

Figure Lengend Snippet: A. Confocal micrographs of U2OS cells treated with siCtrl, siAPMAP and siAPMAP rescued with siRNA resistant APMAP FL overexpression, incubated with and without TBHP. Cells were stained with BODIPY-C11 to determine the level of oxidation under each condition; Red, reduced form of BODIPY-C11 and Green, oxidized form of BODIPY-C11 B. Line scan (line width of 100 pixels) quantification of 510 nm shift (green; oxidized BODIPY-C11) on the cell surface of siAPMAP treated U2OS cells compared to siCtrl cells C. Fluorescent integrated density of 510 nm shift (green; oxidized) in BODIPY-C11 at the cell periphery was quantified using ImageJ. The statistical significance was assessed by one-way ANOVA with Sidak’s multiple comparison (p=0.0149; 30 cells per condition; N=3). Means +/- SDs shown D. Confocal micrographs of larval FB tissue sections from control ( Dcg-Gal4 line) and dAPMAP-RNAi line with FB-specific RNAi depletion, stained with BODIPY-C11. Images represent oxidized (green) BODIPY-C11 staining and reduced (red) BODIPY-C11 staining in RNAi depleted tissue compared to control tissues. Scale bar= 10 μm E. Quantification of oxidized over reduced BODIPY-C11 in of larval FB tissues represented in was quantified using ImageJ. ***P<0.0021; Two-way ANOVA with Sidak’s multiple comparison F. Live confocal micrographs of siCtrl and siAPMAP treated Huh7 cells expressed with ROS biosensor HyPer-ER lumen (denoted HyPER here) construct showing 405 and 488 stimulated fluorescence for 6 mins after treatment with 2mM H 2 O 2 G. Line graph of fluorescence emission of 488/405 ratio shift measured using HyPer-ERlum in siCtrl and siAPMAP treated Huh7 cells incubated with 2 mM H 2 O 2 . Rescue experiments using different APMAP fragments also shown. Line graphs represent mean of +/- 95% confidence interval (CI) of fluorescence shift. CIs of all conditions shown in dotted lines H. Quantification of oxidized over reduced BODIPY-C11 from WT and APMAP FL overexpressed U2OS cells at 0 and 2 h after 2 mM H 2 O 2 treatment, were quantified using ImageJ. The statistical significance was assessed by Ordinary one-way ANOVA with Sidak’s multiple comparison (****P<0.0001; n = 30; N=3). Means +/- SEMs shown I. Violin scatter dot plots demonstrating rescue experiment of ER membrane expansion in siAPMAP Huh7 cells by treating with 200uM NAC for 16 h. The plot depicts the ratio of the percent area of CLIMP-63 positive pixels over percent positive pixels of Calnexin per cell. Individual data points from more than 50 cells from three sets of independent experiments (**** P<0.0001; ***P<0.0002; Ordinary one-way ANOVA with Sidak’s multiple comparisons; α = 0.05) J. Rescue experiment of LD morphology in siAPMAP Huh7 cells treated using ROS inhibitor NAC for 16 h. Violin scatter dot plots represent average area covered by LDs per cell in a given ROI. Total LD area was derived from more than 10 ROI, each consisting of 10-15 cells from three sets of experiments (N =3, ****p<0.0001; ***P<0.0002; one-way ANOVA with Sidak’s multiple comparison) K. Violin scatter dot plots demonstrating rescuing of intracellular ApoB levels in siAPMAP Huh7 cells through NAC treatment for 16 h. Each dot depicts the percent area of ApoB positive pixels per cell. (n>50; N=3; **** P<0.0001; Ordinary one-way ANOVA with Sidak’s multiple comparisons; α = 0.05)

Article Snippet: Cells were transfected with scrambled siRNA (Silencer Select negative control, Thermo Fisher 4390843 or Silencer Negative Control 1, Thermo Fisher AM4611) and APMAP siRNA (Silencer Select siRNA, Thermo Fisher s32757) with a final concentration of 10 nM, using Lipofectamine RNAiMAX reagent (Thermo Fisher 13778075) for 48 h. Cells were transfected with pre-incubated siRNA with a final concentration of 10 nM siRNA (3.75 μl of lipofectamine RNAiMAX in 125 μls of Opti-MEM, Gibco 31985-070) for 48 h. Cells were transfected again the following day with 10 nM siRNA for a 72 h total knockdown time.

Techniques: Over Expression, Incubation, Staining, Comparison, Construct, Fluorescence, Membrane, Derivative Assay